
In a newly published chart, Elliott Wave specialist and crypto analyst Big Mike (@Michael_EWpro) outlines a precise roadmap for Bitcoin’s price action, indicating that a break above $95,000—or a bounce from lower support near $72,895—could propel BTC toward the $130,000–$140,000 region. His analysis builds on detailed wave counts, multiple Fibonacci extension targets, and critical moving averages, offering a granular look at the BTC’s near- and mid-term possibilities.
What’s Next For Bitcoin?
Big Mike’s chart displays a complex Elliott Wave structure consisting of five main impulse waves and interspersed corrective sub-waves. A key area labeled near $72,895 corresponds to wave (c)(iv), representing a major potential bottom if the market breaks below $78,000 and continues lower.
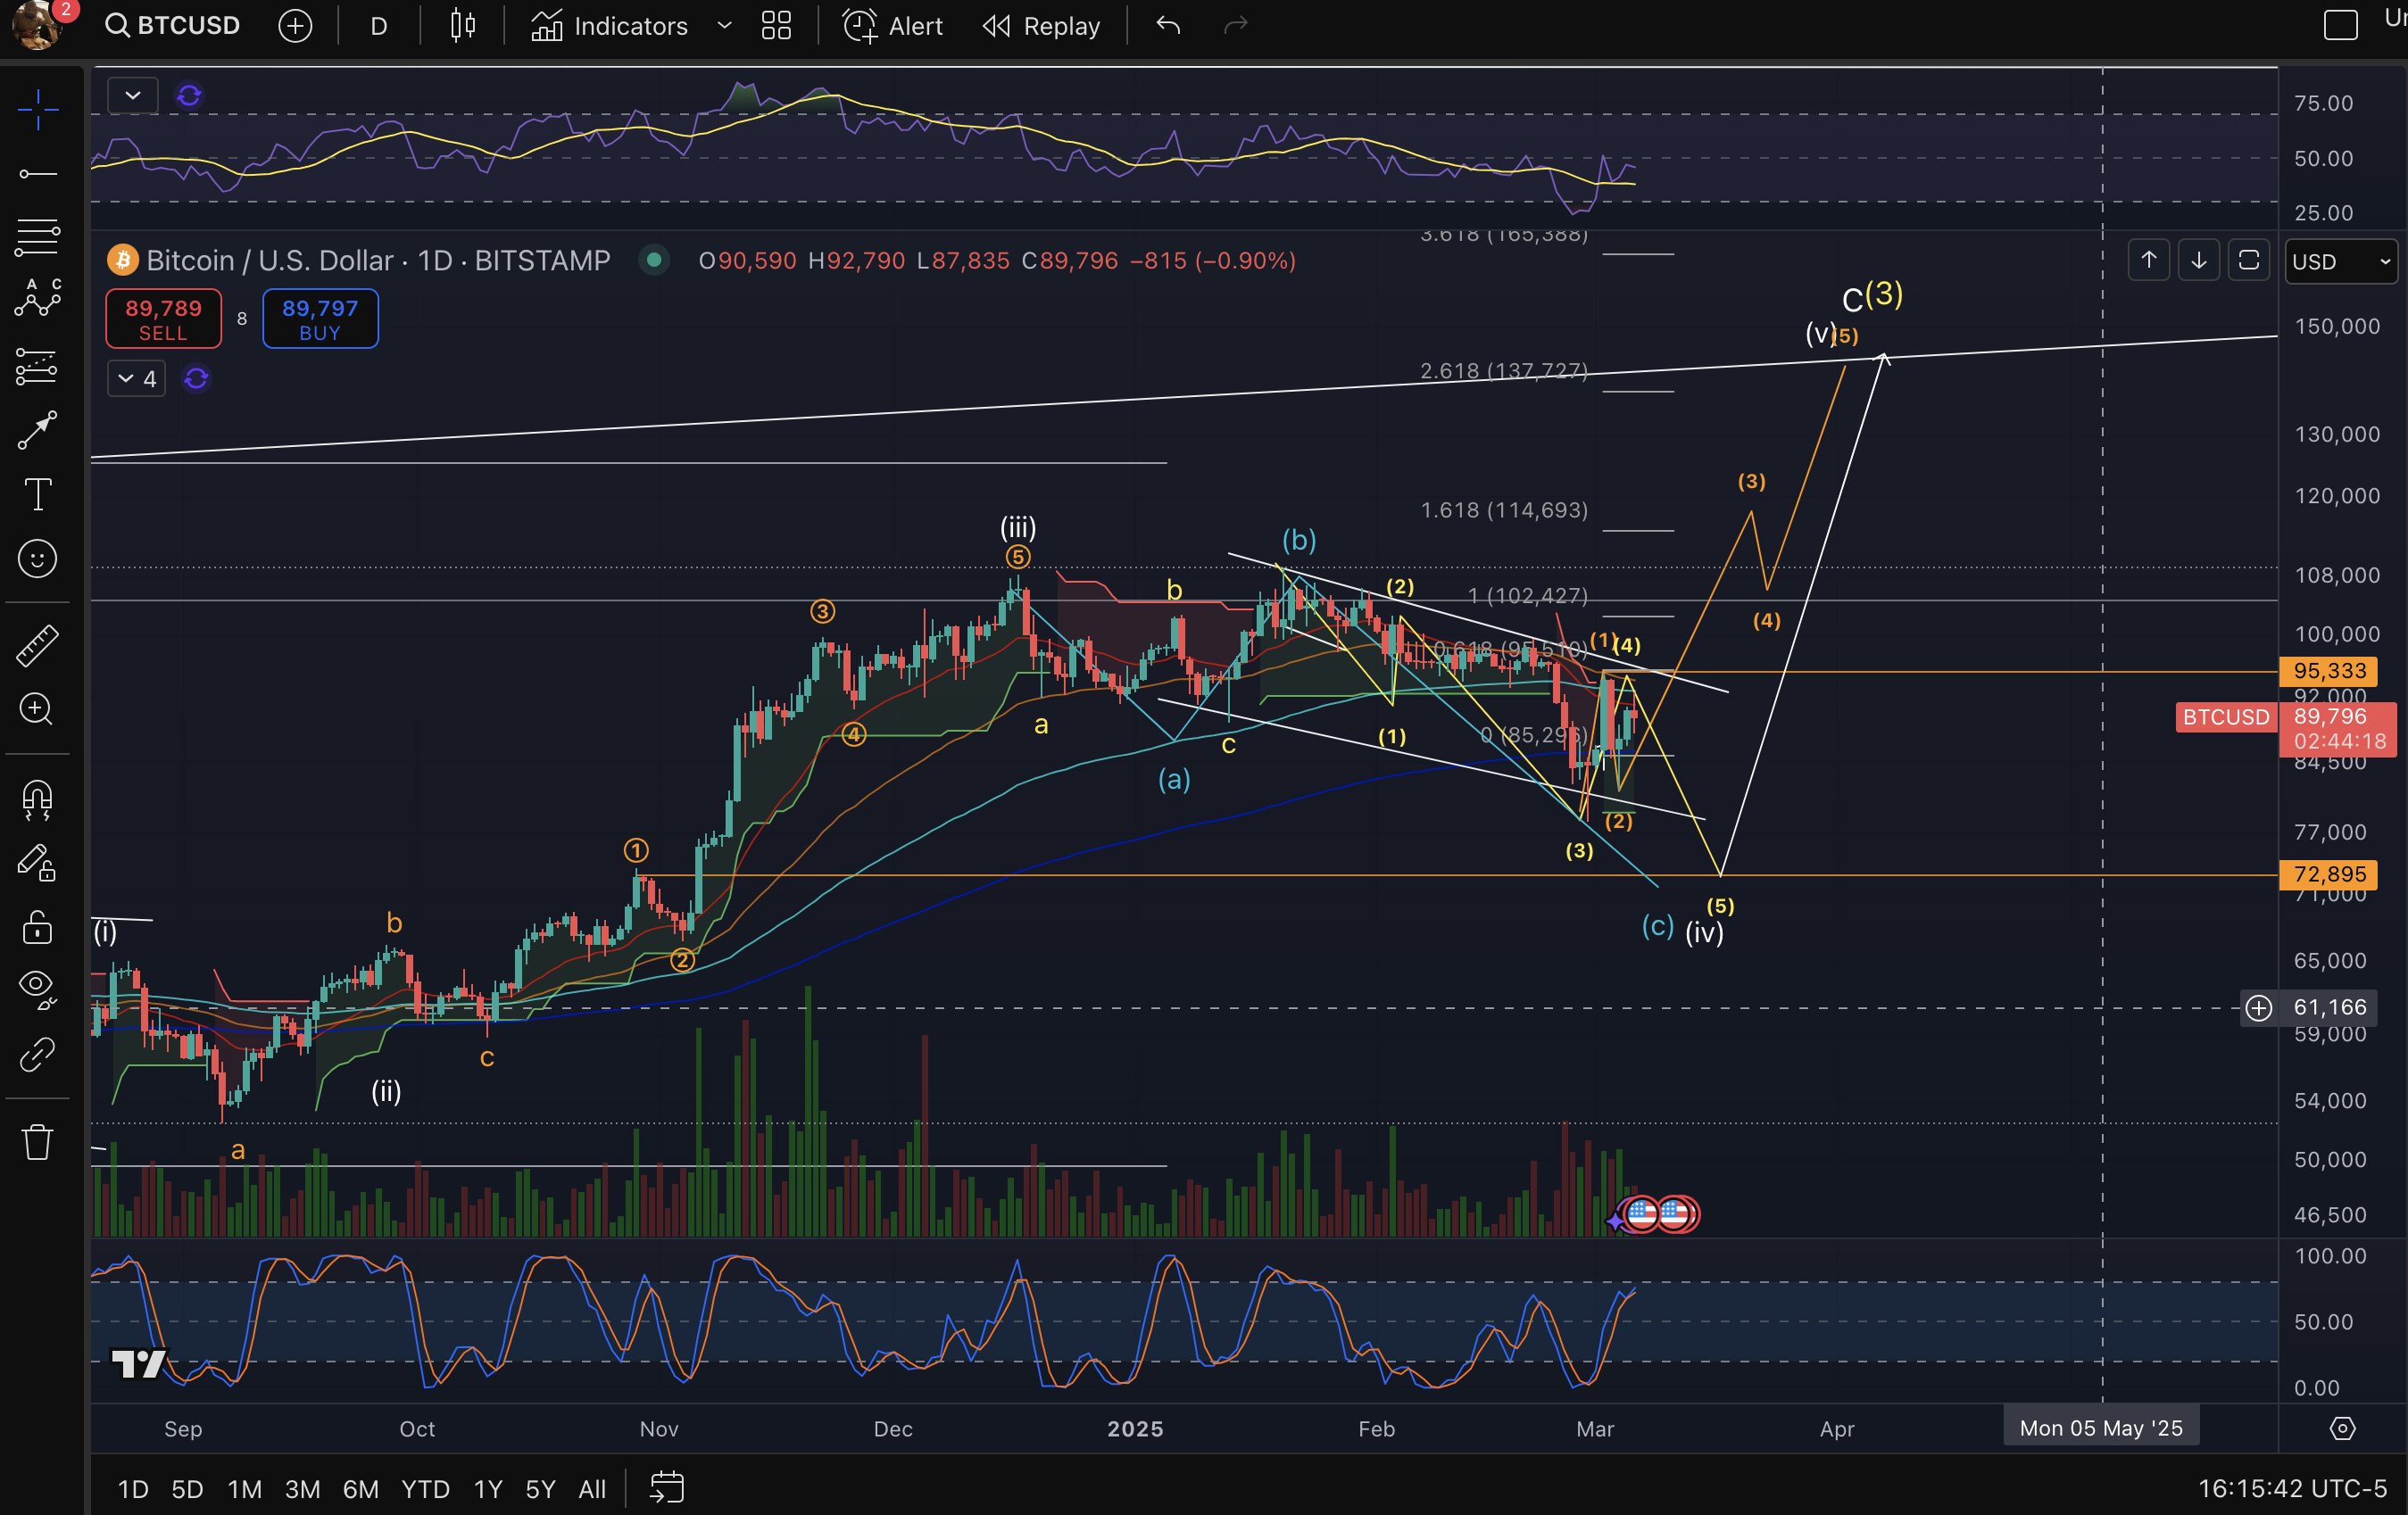
Notable corrective waves around $85,000 to $95,000 appear to have formed a larger consolidation phase, which he regards as a precursor to the next directional move. The chart also pinpoints an upside pathway from roughly $95,000, projecting impulse waves (3), (4), and (5) that extend into the $100,000–$140,000 zone.
Fibonacci extension targets appear at approximately $114,693 (1.618 extension) which could be the target for wave (3), followed by a corrective move to $102,000 before starting wave 5 which aims for $137,727 (2.618 extension), or even a final leg near $150,000 aligns with wave c(3).
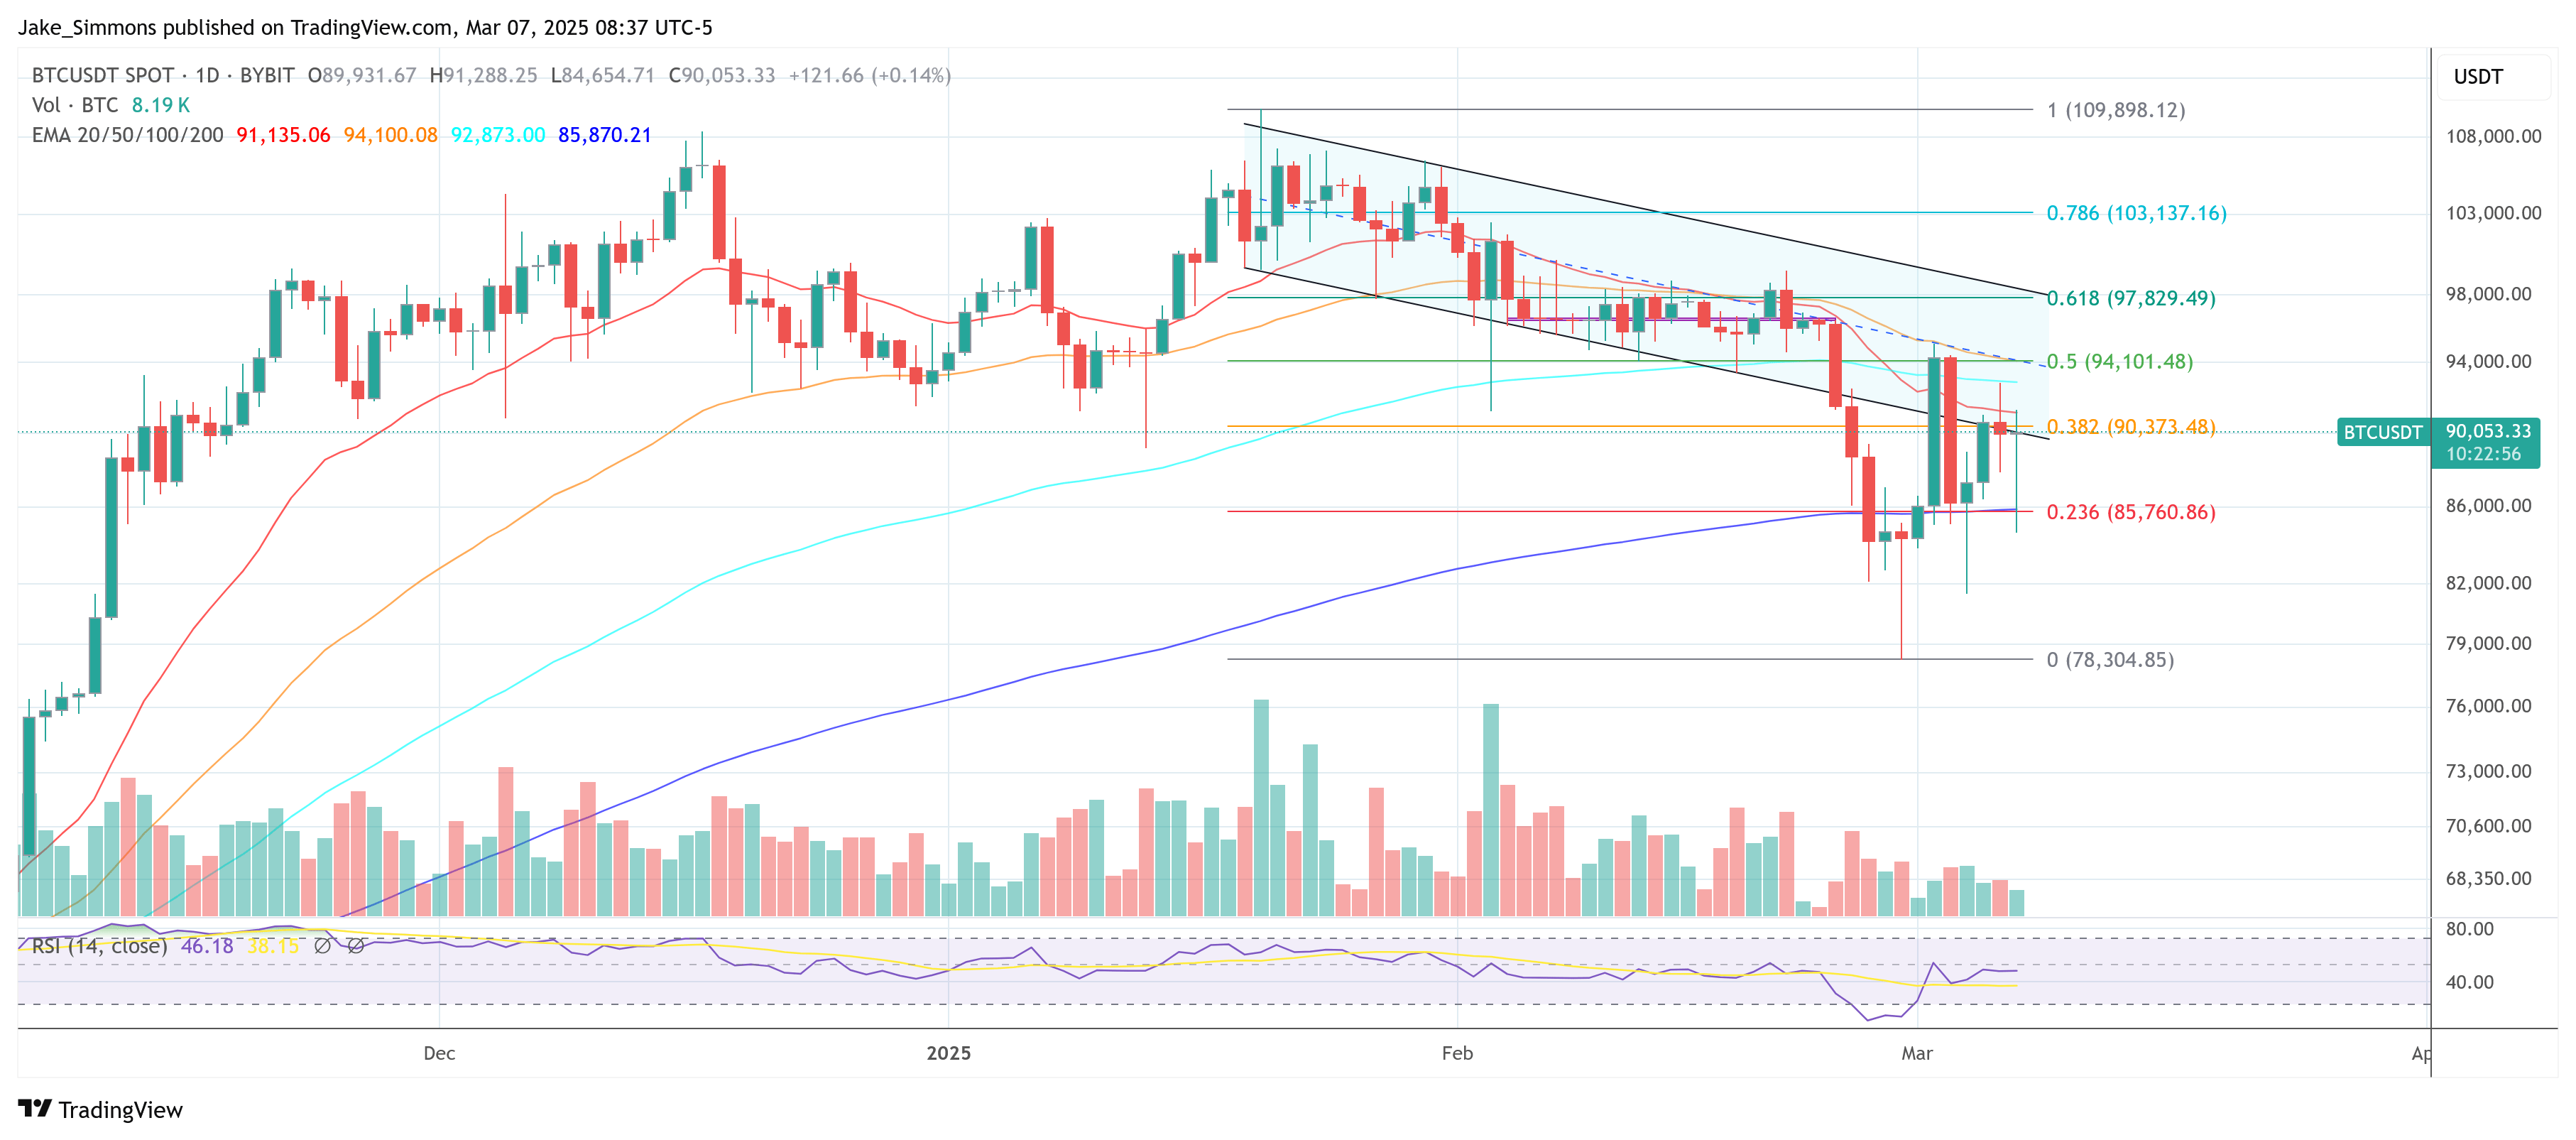
Moving averages in the $72,000–$90,000 range underscore the significance of support near $78,000–$72,895, while an upper band around $90,000–$95,000 represents a crucial resistance corridor. The analyst observes a descending wedge formation from mid-February to early March, spanning $95,000 down to $85,000, and notes that an upside breakout could herald a renewed push into six-figure territory.
Volume profiles indicate subdued participation during recent corrective phases, alongside a neutral Stochastic RSI reading that suggests momentum could shift decisively depending on which price threshold gives way first.
Big Mike emphasizes two critical lines in the sand: “BTC above $95k will trigger the move quickly towards my target of $130-$140k. Below $78k and we test $72k, then run to $140k.” From his perspective, both a direct break above $95,000 and a deeper dip to $72,895 ultimately converge on the same upside target near $130,000–$140,000.
At press time, BTC traded at $90,053.
This articles is written by : Fady Askharoun Samy Askharoun
All Rights Reserved to Amznusa www.amznusa.com
Why Amznusa?
AMZNUSA is a dynamic website that focuses on three primary categories: Technology, e-commerce and cryptocurrency news. It provides users with the latest updates and insights into online retail trends and the rapidly evolving world of digital currencies, helping visitors stay informed about both markets.
