
XRP price started a fresh decline below $2.00. The price is now recovering from $1.820 and might face hurdles near the $2.150 pivot level.
- XRP price started a recovery wave from the $1.820 zone.
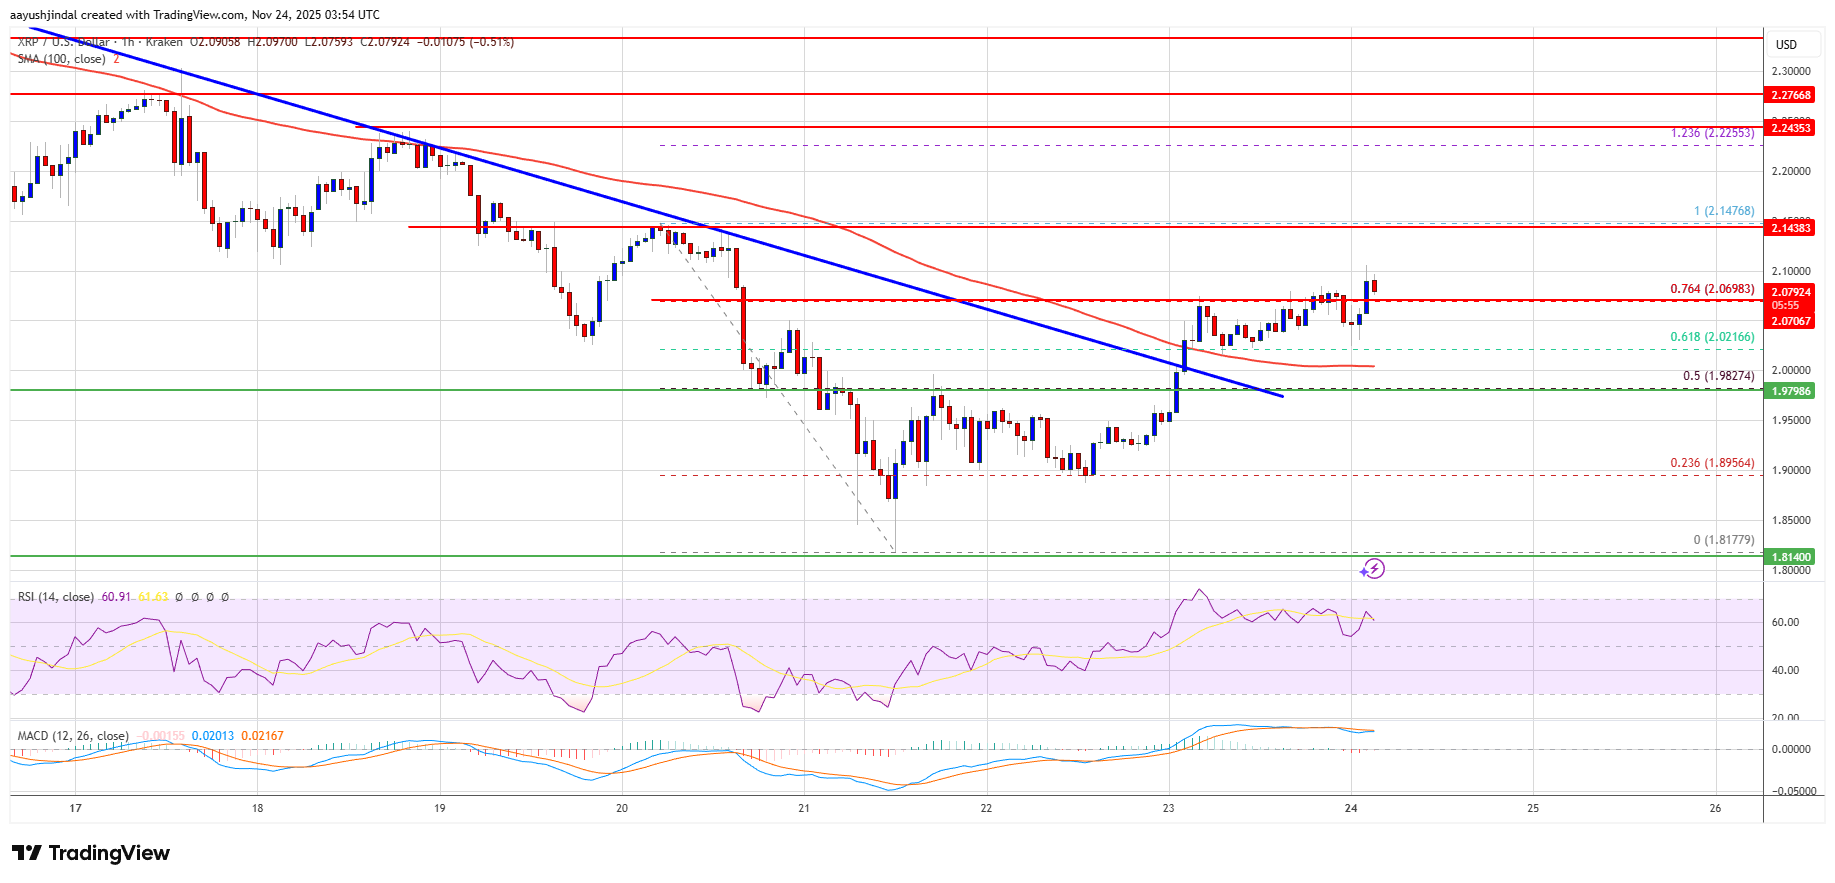
- The price is now trading above $2.00 and the 100-hourly Simple Moving Average.
- There was a break above a key bearish trend line with resistance at $2.00 on the hourly chart of the XRP/USD pair (data source from Kraken).
- The pair could continue to move up if it settles above $2.150.
XRP Price Eyes Recovery
XRP price extended losses below the $2.00 support, like Bitcoin and Ethereum. The price even spiked below $1.90 before the bulls appeared. A low was formed at $1.8177, and the price is now attempting to recover.
There was a move above the $1.88 and $1.95 levels. The bulls were able to push the price above the 50% Fib retracement level of the downward move from the $2.140 swing high to the $1.817 low. Besides, there was a break above a key bearish trend line with resistance at $2.00 on the hourly chart of the XRP/USD pair.
The price is now trading above $2.00 and the 100-hourly Simple Moving Average. It is also above the 76.4% Fib retracement level of the downward move from the $2.140 swing high to the $1.817 low.
If there is a fresh upward move, the price might face resistance near the $2.120 level. The first major resistance is near the $2.150 level. A close above $2.150 could send the price to $2.20. The next hurdle sits at $2.250. A clear move above the $2.250 resistance might send the price toward the $2.320 resistance. Any more gains might send the price toward the $2.350 resistance. The next major hurdle for the bulls might be near $2.40.
Another Decline?
If XRP fails to clear the $2.150 resistance zone, it could start a fresh decline. Initial support on the downside is near the $2.00 level. The next major support is near the $1.980 level.
If there is a downside break and a close below the $1.980 level, the price might continue to decline toward $1.880. The next major support sits near the $1.8450 zone, below which the price could continue lower toward $1.80.
Technical Indicators
Hourly MACD – The MACD for XRP/USD is now gaining pace in the bullish zone.
Hourly RSI (Relative Strength Index) – The RSI for XRP/USD is now above the 50 level.
Major Support Levels – $1.980 and $1.880.
Major Resistance Levels – $2.150 and $2.250.
This articles is written by : Fady Askharoun Samy Askharoun
All Rights Reserved to Amznusa www.amznusa.com
Why Amznusa?
AMZNUSA is a dynamic website that focuses on three primary categories: Technology, e-commerce and cryptocurrency news. It provides users with the latest updates and insights into online retail trends and the rapidly evolving world of digital currencies, helping visitors stay informed about both markets.
