
Ethereum price started a recovery wave above the $2,100 zone. ETH is now consolidating and might struggle to continue higher above the $2,150 resistance.
- Ethereum started a recovery wave from the $2,075 zone.
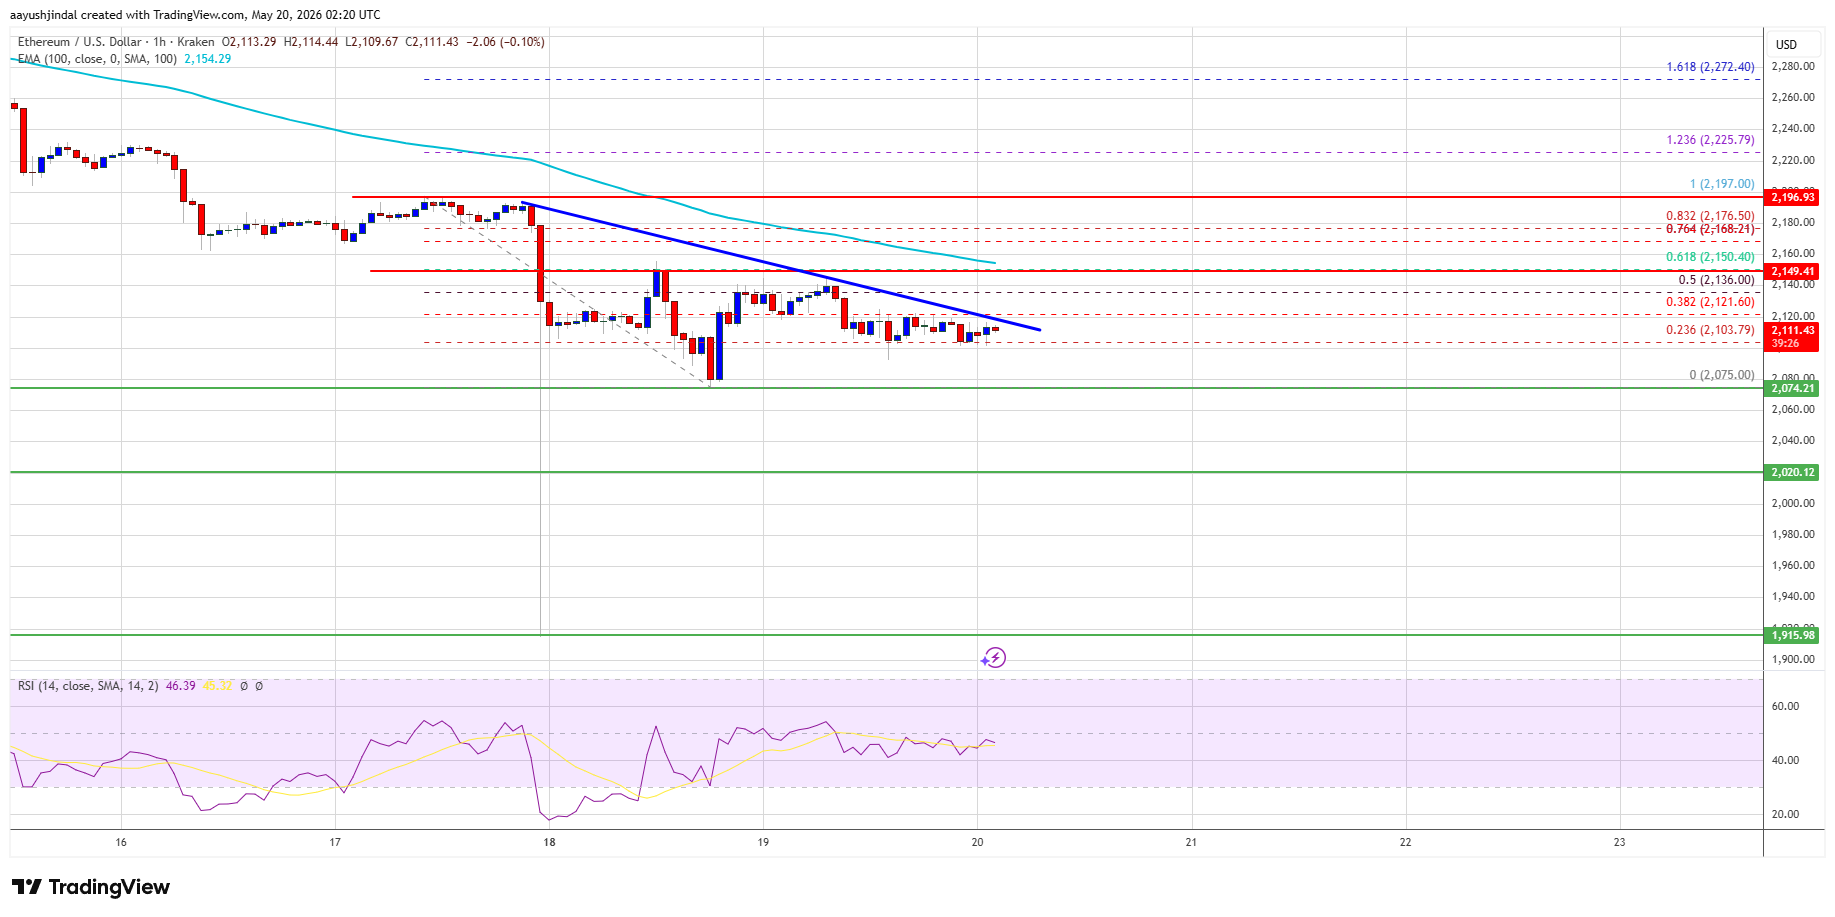
- The price is trading below $2,120 and the 100-hourly Simple Moving Average.
- There is a bearish trend line forming with resistance at $2,120 on the hourly chart of ETH/USD (data feed via Kraken).
- The pair could start a fresh decline if it stays below the $2,150 zone.
Ethereum Price Faces Hurdles
Ethereum price remained bid above the $2,050 support zone, like Bitcoin. ETH price formed a base and started a recovery wave above the $2,065 resistance.
The price surpassed the 38.2% Fib retracement level of the downward move from the $2,197 swing high to the $2,075 swing low. The bulls even pushed the price toward $2,150 but the bears remained active. Besides, there is a bearish trend line forming with resistance at $2,120 on the hourly chart of ETH/USD.
Ethereum price is now trading below $2,120 and the 100-hourly Simple Moving Average. If the bulls remain in action above $2,075, the price could attempt another increase. Immediate resistance is seen near the $2,120 level. The first key resistance is near the $2,150 level or the 61.8% Fib retracement level of the downward move from the $2,197 swing high to the $2,075 swing low.
The next major resistance is near the $2,200 level. A clear move above the $2,200 resistance might send the price toward the $2,220 resistance. An upside break above the $2,220 region might call for more gains in the coming days. In the stated case, Ether could rise toward the $2,300 resistance zone or even $2,315 in the near term.
More Losses In ETH?
If Ethereum fails to clear the $2,150 resistance, it could start a fresh decline. Initial support on the downside is near the $2,085 level. The first major support sits near the $2,075 zone.
A clear move below the $2,075 support might push the price toward the $2,020 support. Any more losses might send the price toward the $2,000 region. The main support could be $1,940.
Technical Indicators
Hourly MACD – The MACD for ETH/USD is gaining momentum in the bearish zone.
Hourly RSI – The RSI for ETH/USD is now below the 50 zone.
Major Support Level – $2,050
Major Resistance Level – $2,150
This articles is written by : Fady Askharoun Samy Askharoun
All Rights Reserved to Amznusa www.amznusa.com
Why Amznusa?
AMZNUSA is a dynamic website that focuses on three primary categories: Technology, e-commerce and cryptocurrency news. It provides users with the latest updates and insights into online retail trends and the rapidly evolving world of digital currencies, helping visitors stay informed about both markets.
