Bitcoin recently flushed a key liquidity zone below the $116K mark, triggering a period of sideways consolidation.
With the FOMC meeting scheduled for Wednesday, traders are bracing for a potentially significant price move driven by macroeconomic developments.
Technical Analysis
By ShayanMarkets
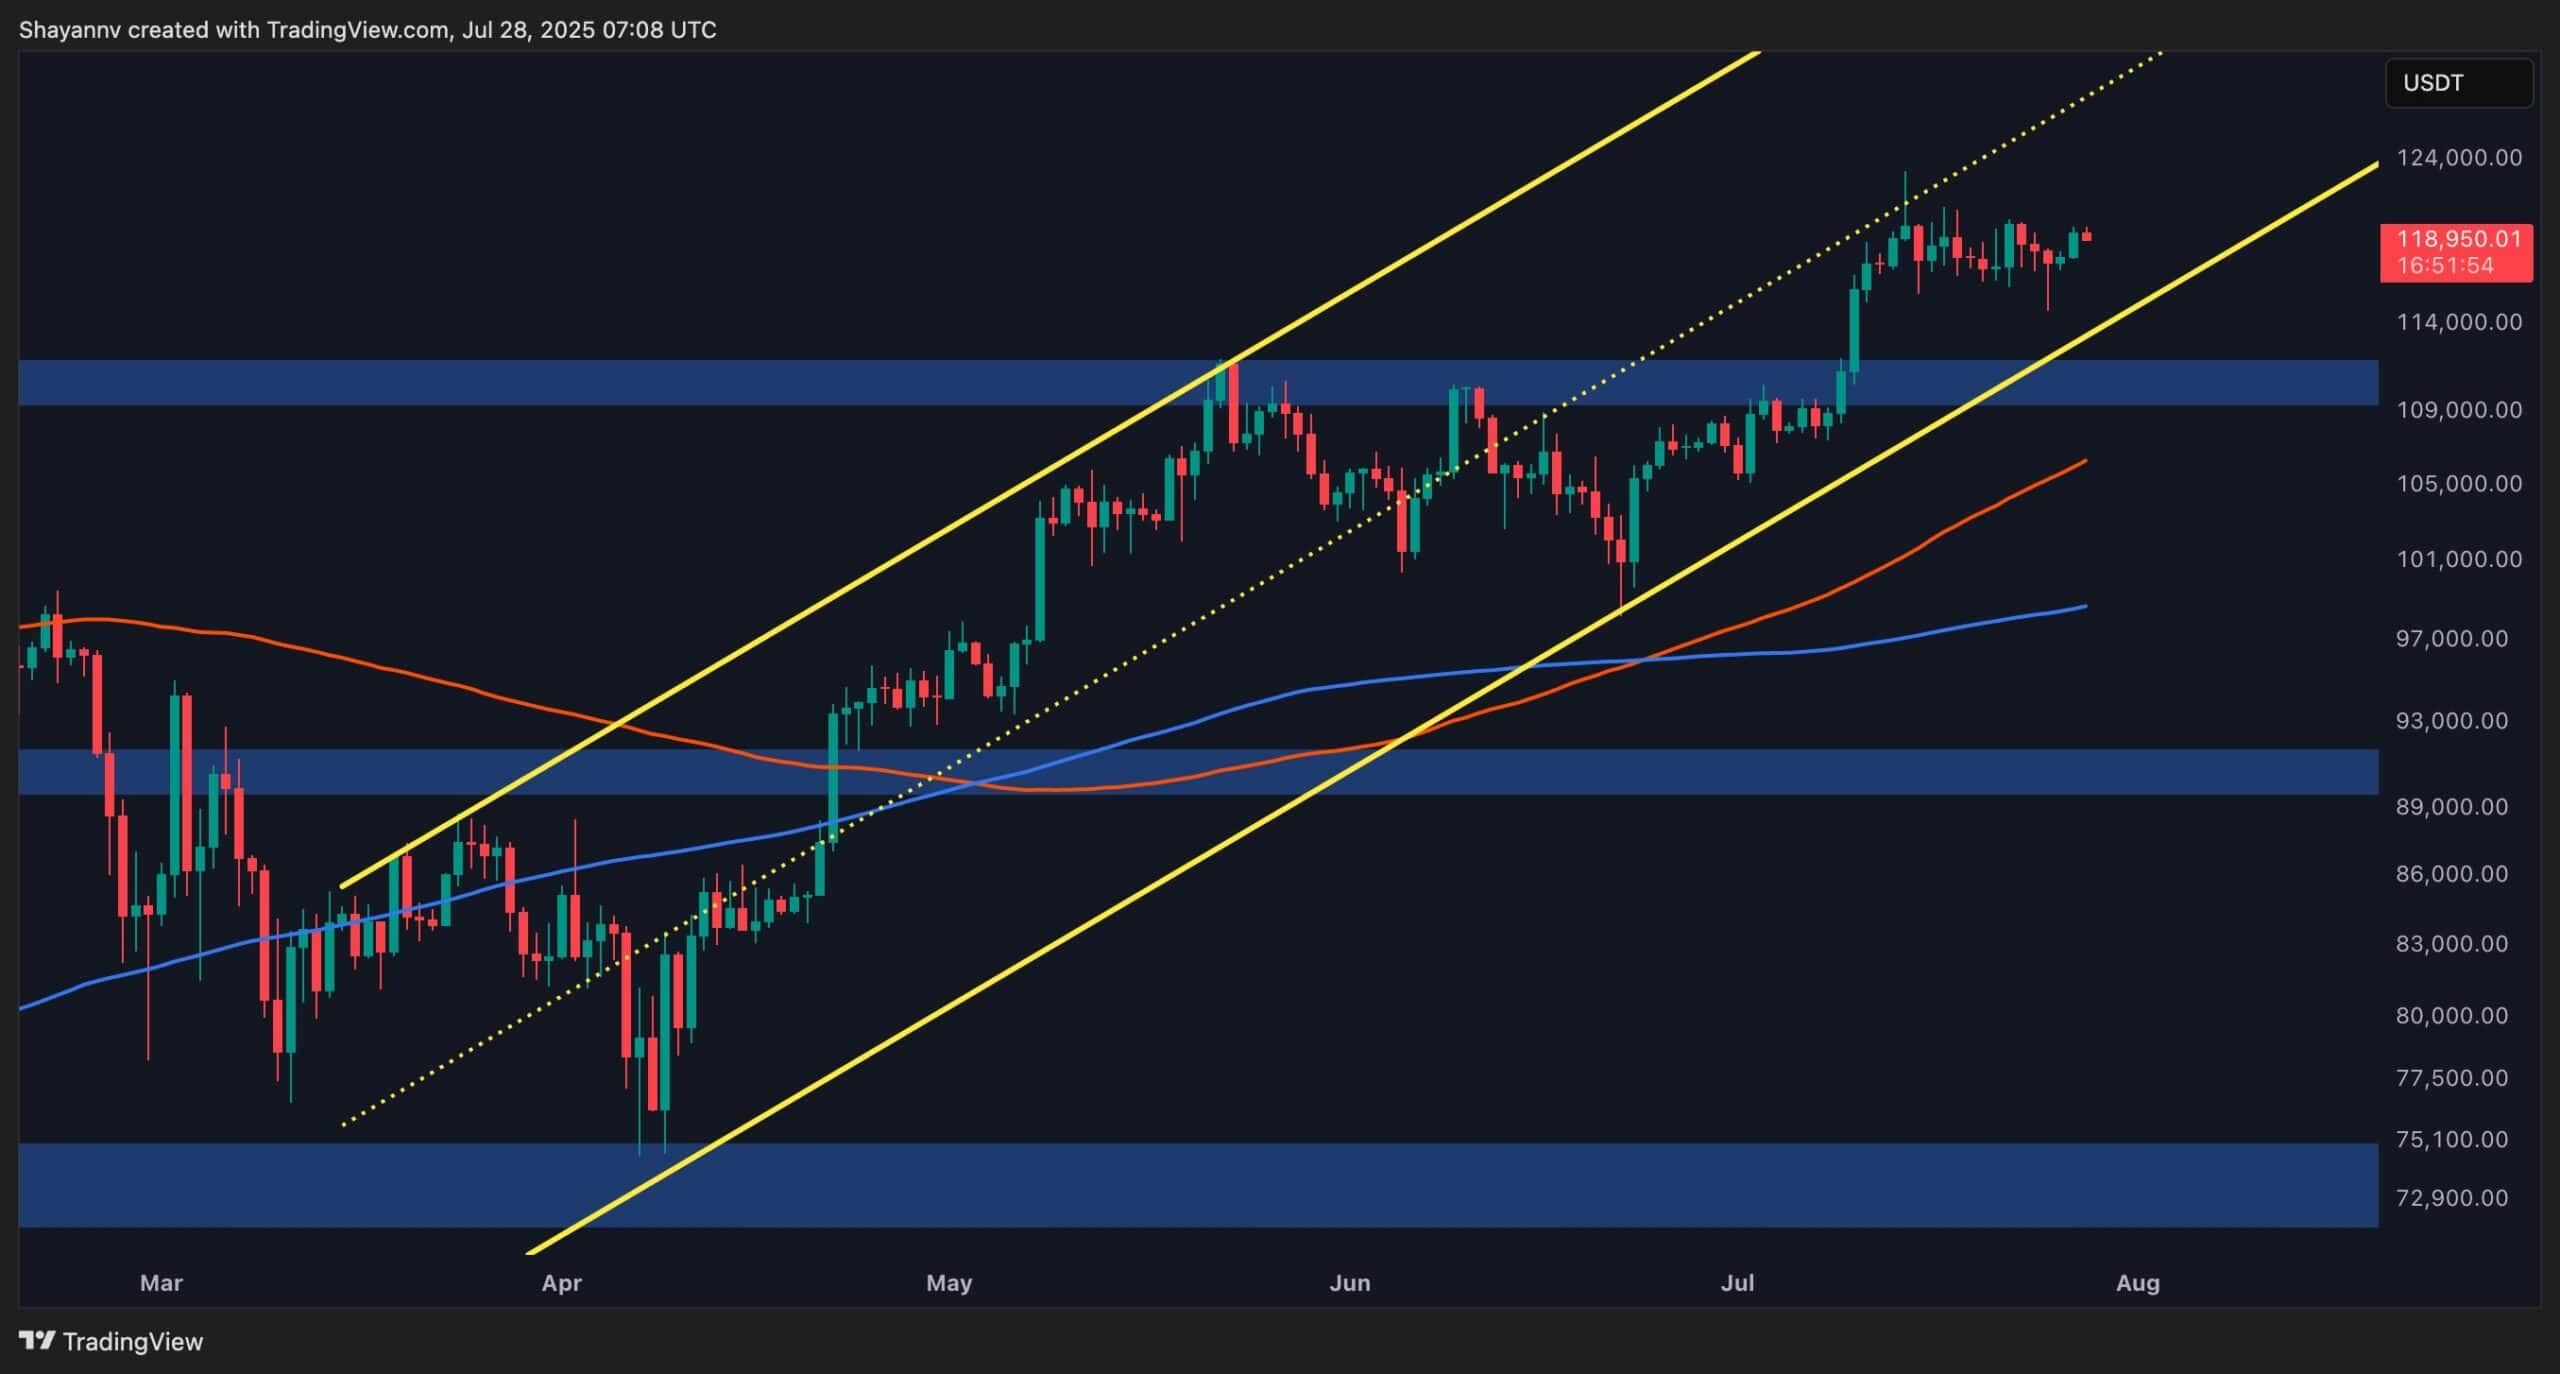
The Daily Chart
Bitcoin remains within a steep ascending price channel, recently triggering a sweep of significant sell-side liquidity just below the $116K level. This area was loaded with stop-losses and long liquidations, which were flushed as the market dipped.
Despite a short-term rebound following the sweep, bullish momentum has yet to regain full strength, likely due to a spike in supply pressure following a historic whale transaction, where one of the oldest known wallets moved dormant BTC after years of inactivity.
Currently, Bitcoin is consolidating between the ascending channel’s support at $114K and the ATH resistance around $123K. This range-bound behavior reflects market hesitation ahead of the FOMC meeting scheduled for Wednesday, which is expected to trigger a major volatility event based on the Fed’s rate policy decision.
The 4-Hour Chart
On the lower timeframe, BTC’s corrective drop was absorbed near the 0.5 Fibonacci retracement zone around $115K, prompting a reversal. Moreover, the price action has broken above a bullish flag formation, signaling a potential continuation toward $123K if momentum sustains. However, this bullish setup is contingent upon upcoming macro developments.
All eyes are now on Wednesday’s FOMC meeting, with traders awaiting confirmation of a rate cut or hawkish tone. Depending on the Fed’s stance, Bitcoin could either break above its ATH or revisit lower support zones.
On-chain Analysis
By ShayanMarkets
As Bitcoin continues to trade sideways without a decisive breakout, the behavior of large holders is raising eyebrows across the market. On July 25th, a notable spike in Binance Whale Inflows was recorded, with over $1.2 billion in cumulative BTC entering the exchange in a single day. This surge marks the largest 30-day inflow observed in recent months, signaling a major shift in market dynamics.
This wave of inflows led to immediate short-term selling pressure, pushing Bitcoin down from the $120K resistance to the $115K–$116K support zone, where it currently consolidates. While retail inflows have been gradually rising, they pale in comparison to this whale activity, highlighting a significant imbalance in market supply.
If buyers fail to absorb this wave of supply, further downside toward $110K becomes a likely scenario. However, should Bitcoin rebound from current support, a retest of $121K and potentially new all-time highs remain on the table.
The post Bitcoin Price Analysis: BTC Correction Over? Here’s What Signals a New ATH appeared first on CryptoPotato.
This articles is written by : Fady Askharoun Samy Askharoun
All Rights Reserved to Amznusa www.amznusa.com
Why Amznusa?
AMZNUSA is a dynamic website that focuses on three primary categories: Technology, e-commerce and cryptocurrency news. It provides users with the latest updates and insights into online retail trends and the rapidly evolving world of digital currencies, helping visitors stay informed about both markets.
