
Ethereum is trading above the $1,500 mark after a week of heightened volatility and continued global trade uncertainty. Macroeconomic tensions — driven by tariffs, shifting policies, and weakened investor sentiment — continue to weigh heavily on crypto markets. Despite the recent bounce, Ethereum’s price action still hints at a broader downtrend, with bulls struggling to reclaim key resistance levels that could trigger a meaningful recovery.
However, there are signs of potential strength ahead. If bulls manage to push ETH above immediate resistance zones, a bullish momentum shift could emerge. Market watchers are closely monitoring cost basis levels to identify where strong demand may resurface.
According to data from Glassnode, Ethereum’s Cost Basis Distribution reveals three key price clusters likely to shape short-term action. Among them, the $1,546 level stands out as the most significant, with 822,440 ETH previously accumulated in this range. A successful hold or breakout above this zone could provide a solid foundation for a larger recovery.
For now, Ethereum’s outlook remains cautiously neutral, with bulls needing to reclaim higher levels to shift sentiment and challenge the broader downtrend.
Ethereum Key Cost Basis Levels Could Define Price Action
Ethereum has lost over 50% of its value since early February, setting the stage for a challenging but potentially pivotal recovery phase. After months of heavy selling pressure, ETH is now trading just above the $1,500 mark, a zone that could serve as a springboard if bullish momentum builds. While the broader market has shown signs of recovery, Ethereum’s underwhelming price action continues to test investor patience. Still, analysts believe a recovery rally is possible, especially if macroeconomic sentiment improves.
Persistent global trade tensions, ongoing tariff battles, and US foreign policy shifts continue to inject volatility into financial markets. These factors have suppressed demand for risk assets like Ethereum, but some believe that the worst may be behind.
Glassnode’s on-chain data offers a more detailed look at Ethereum’s short-term outlook. According to their Cost Basis Distribution analysis, three price clusters are likely to shape ETH’s near-term price action. Around $1,457, roughly 408,000 ETH were previously accumulated. At $1,546, over 822,000 ETH sit, making it one of the most critical levels. Finally, approximately 725,000 ETH were acquired around $1,598.

These clusters reflect areas of high on-chain activity and are expected to act as support or resistance zones during the current phase of price consolidation. A breakout above the $1,600 level could trigger a more significant move toward $1,800 and beyond. For now, Ethereum’s price remains range-bound, but market participants are watching these levels closely for signs of a decisive shift.
ETH Faces Crucial Resistance As Bulls Fight to Regain Momentum
Ethereum is currently trading at $1,580 after failing to break above the $1,700 resistance level, signaling that bullish momentum remains weak. Despite a brief recovery from recent lows, ETH has struggled to reclaim higher ground, and key resistance levels continue to weigh on price action.
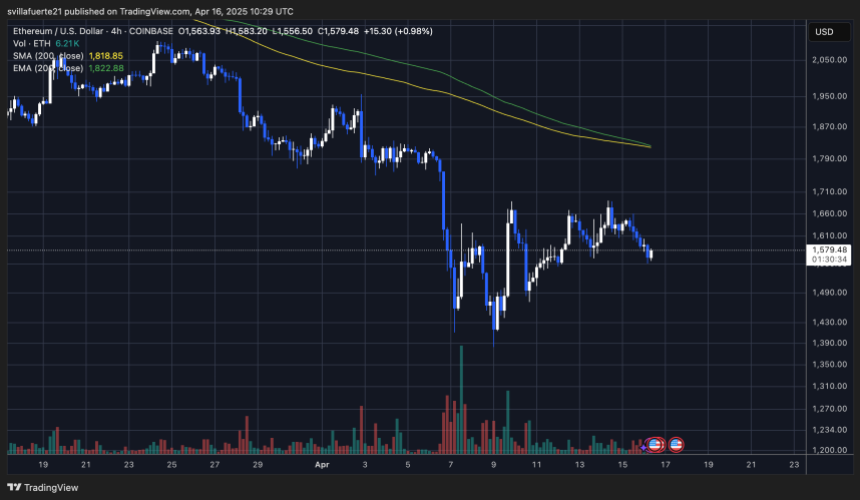
For bulls to confirm the start of a true recovery phase, Ethereum must push above the 4-hour 200 MA and EMA, both hovering around $1,820. A decisive move above these indicators would indicate renewed market confidence and open the door for a push toward critical demand levels around $2,000.
However, the risk of further downside remains. If Ethereum loses the $1,500 support level, selling pressure could accelerate, potentially driving the price below the $1,400 mark. This zone served as a key level in early 2023 and could be retested if bearish momentum builds.
With macroeconomic uncertainty and trade tensions still dominating the narrative, investors remain cautious. The next few trading sessions will be critical for ETH, as it hovers between potential recovery and the threat of renewed decline. Traders should watch for volume spikes and reaction around the $1,700 and $1,500 zones to assess the next move.
Featured image from Dall-E, chart from TradingView
This articles is written by : Fady Askharoun Samy Askharoun
All Rights Reserved to Amznusa www.amznusa.com
Why Amznusa?
AMZNUSA is a dynamic website that focuses on three primary categories: Technology, e-commerce and cryptocurrency news. It provides users with the latest updates and insights into online retail trends and the rapidly evolving world of digital currencies, helping visitors stay informed about both markets.
