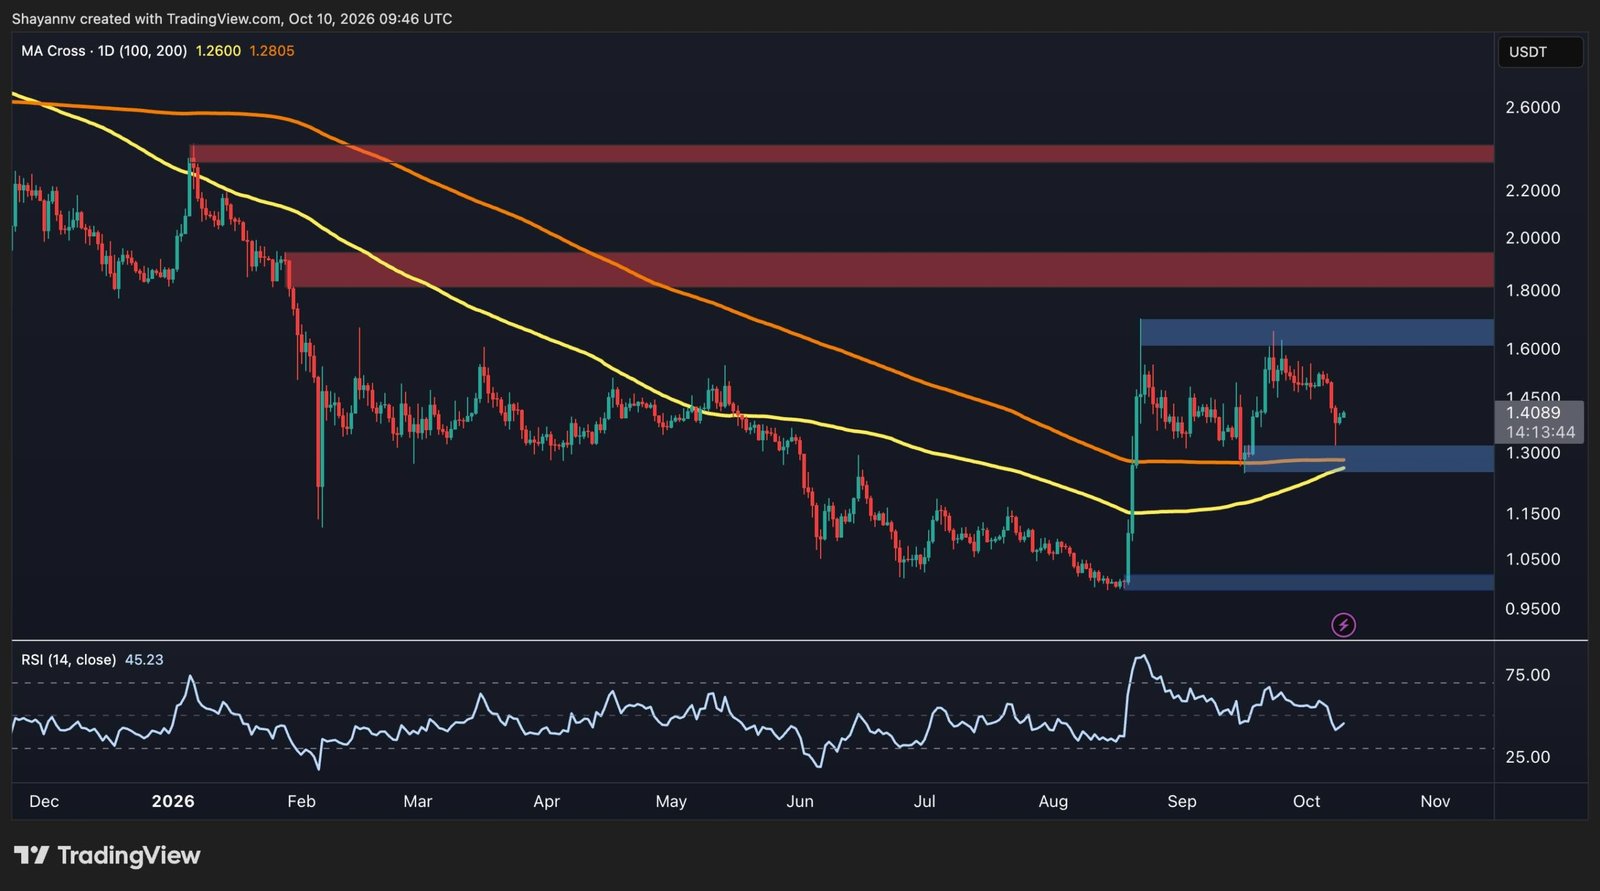
XRP is attempting to stabilize after a sharp correction from its September highs, with the price currently trading around $1.40. While buyers have managed to trigger a rebound from the $1.30 support area, the broader technical picture remains mixed. XRP needs to claim nearby resistance to continue the recovery, while another rejection could expose lower support levels.
Ripple Price Analysis: The USDT Pair
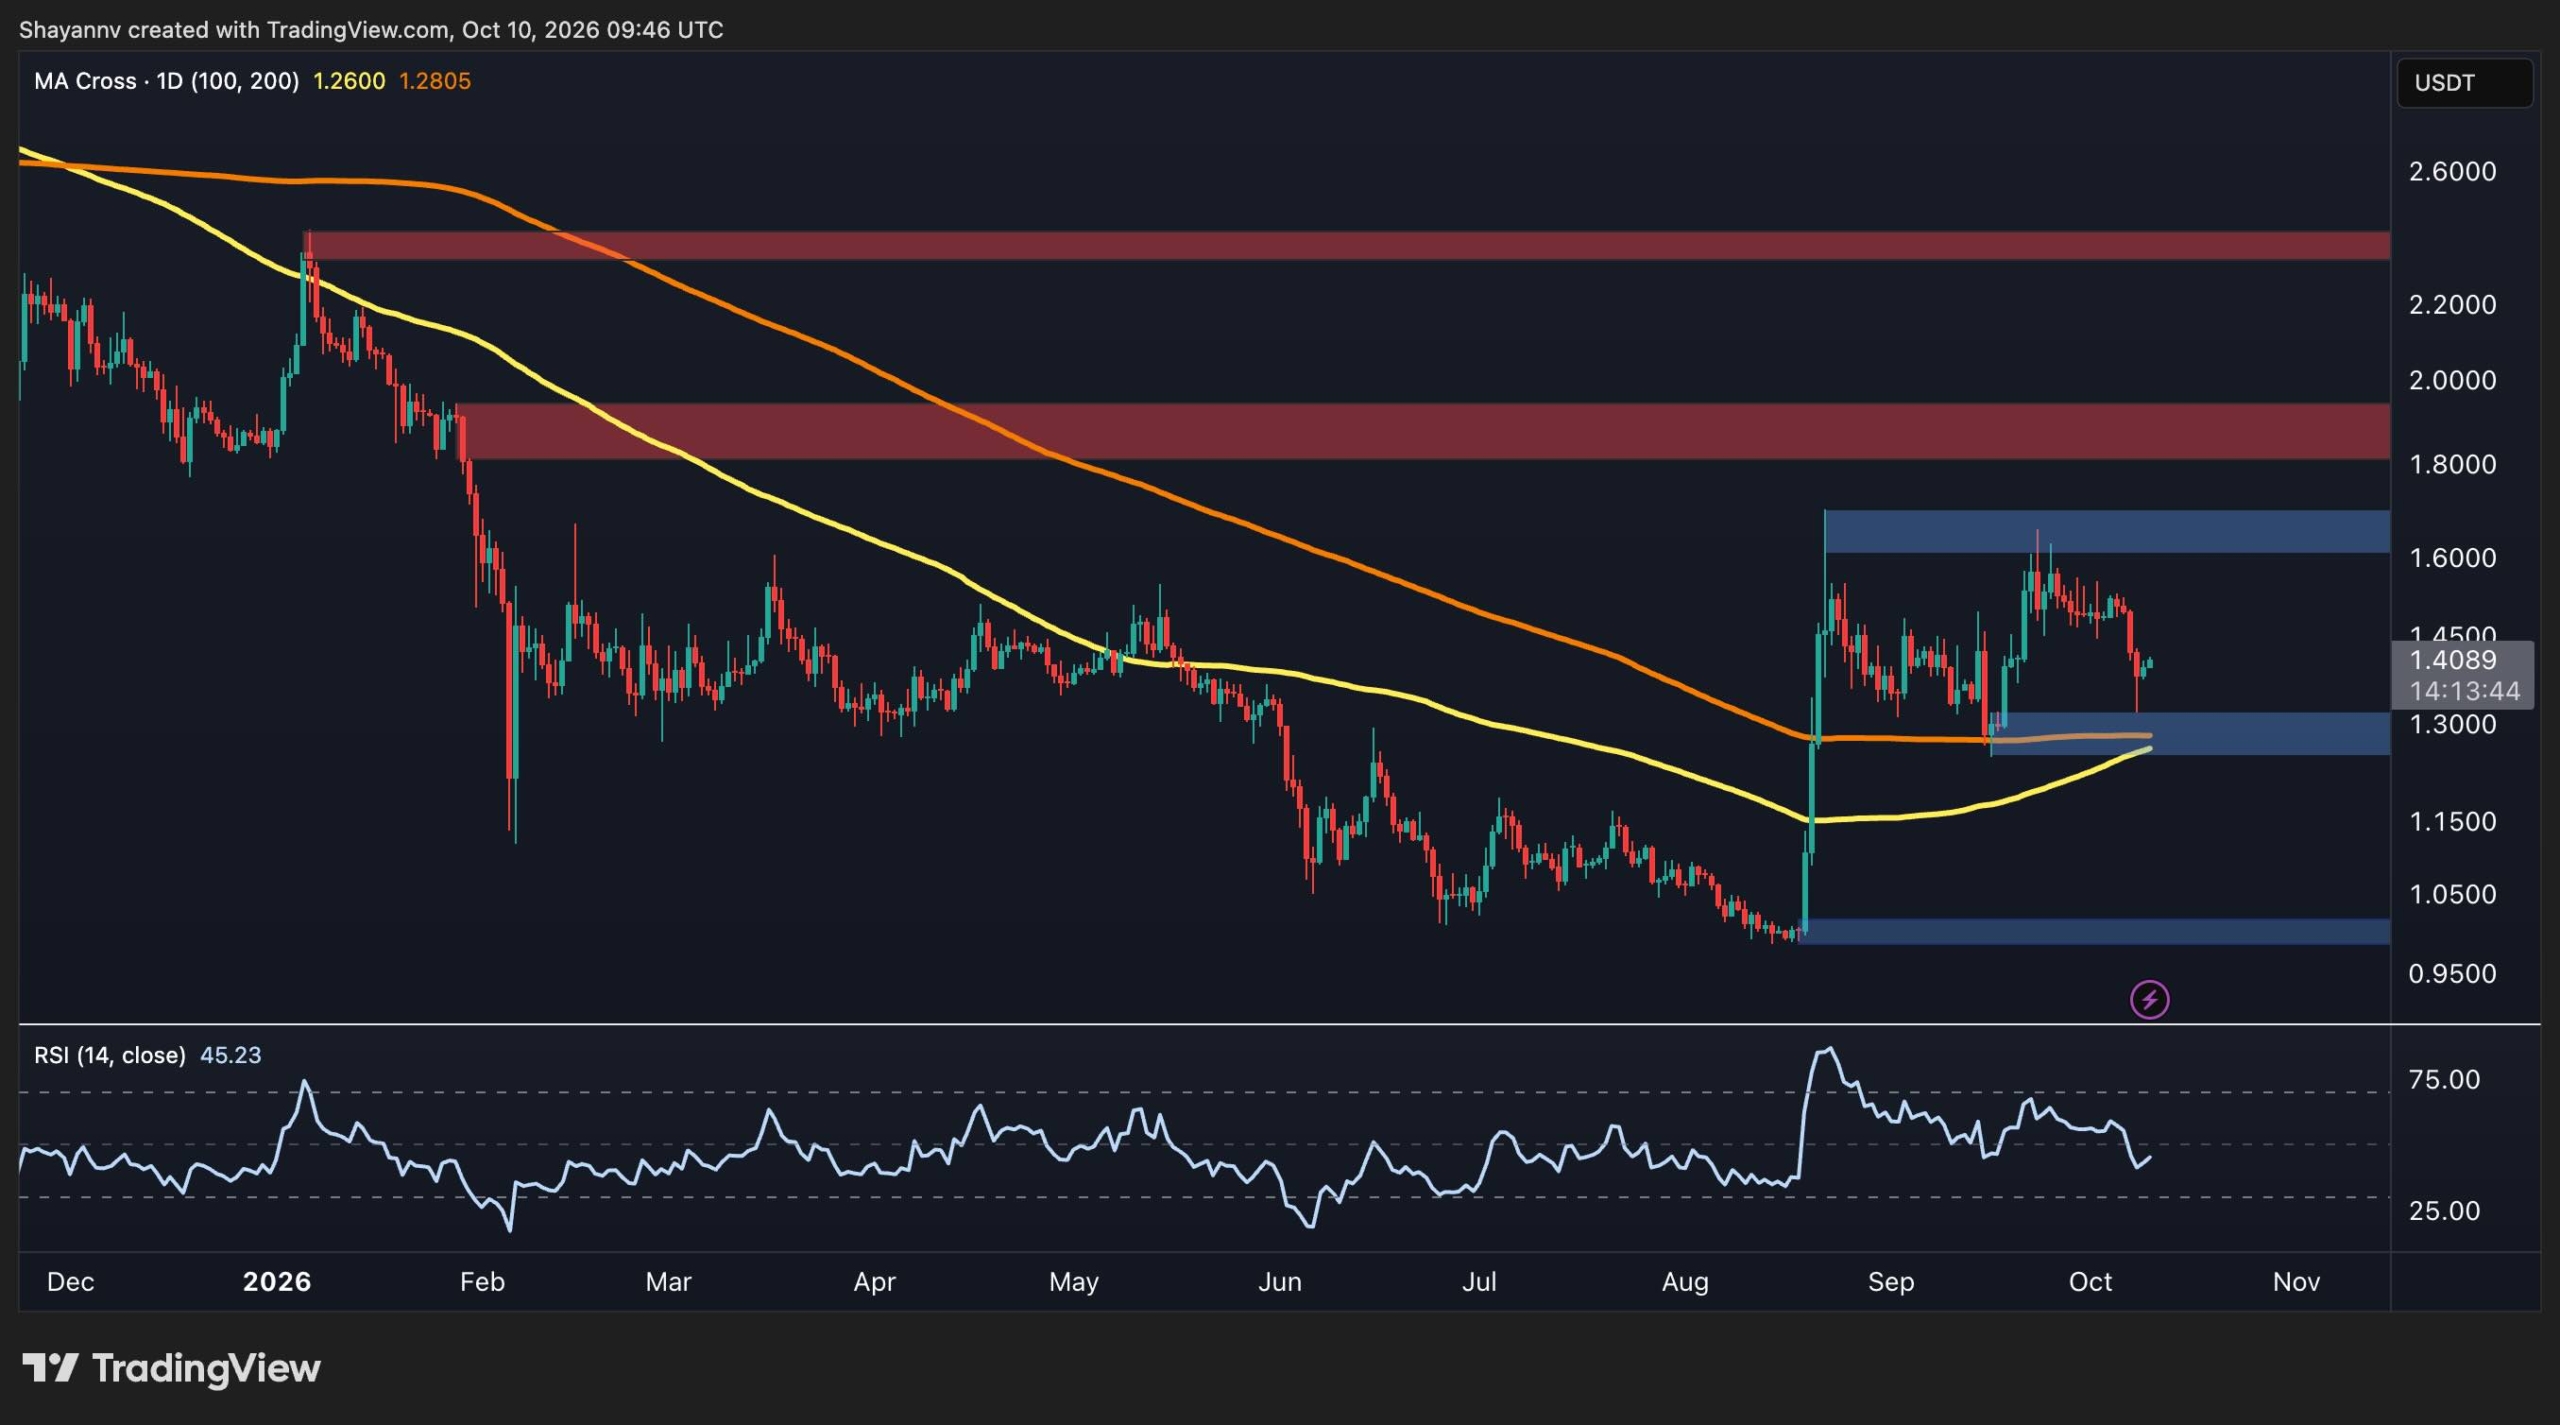
XRP’s daily chart shows a significant recovery from the August lows below $1, followed by a sharp rally that carried the asset toward the $1.60 region. However, the market has rejected this level twice, suggesting bullish momentum has weakened considerably.
The price is currently hovering around $1.40, with the $1.30 zone serving as the key nearby support area. This region has already attracted buying interest, as demonstrated by the recent rebound. Holding this zone could allow the asset to consolidate and attempt another move higher. A decisive breakdown, however, would weaken the recovery structure and bring the $1 support zone back into focus.
The 100-day and 200-day moving averages are also converging for a potential bullish crossover near the $1.30 zone, adding to this level’s importance for XRP’s short- to mid-term trend. Yet, with the RSI dropping below the neutral 50 level, bullish momentum is clearly weak, putting the market at significant risk of losing the key support zone.
The 4-Hour Chart
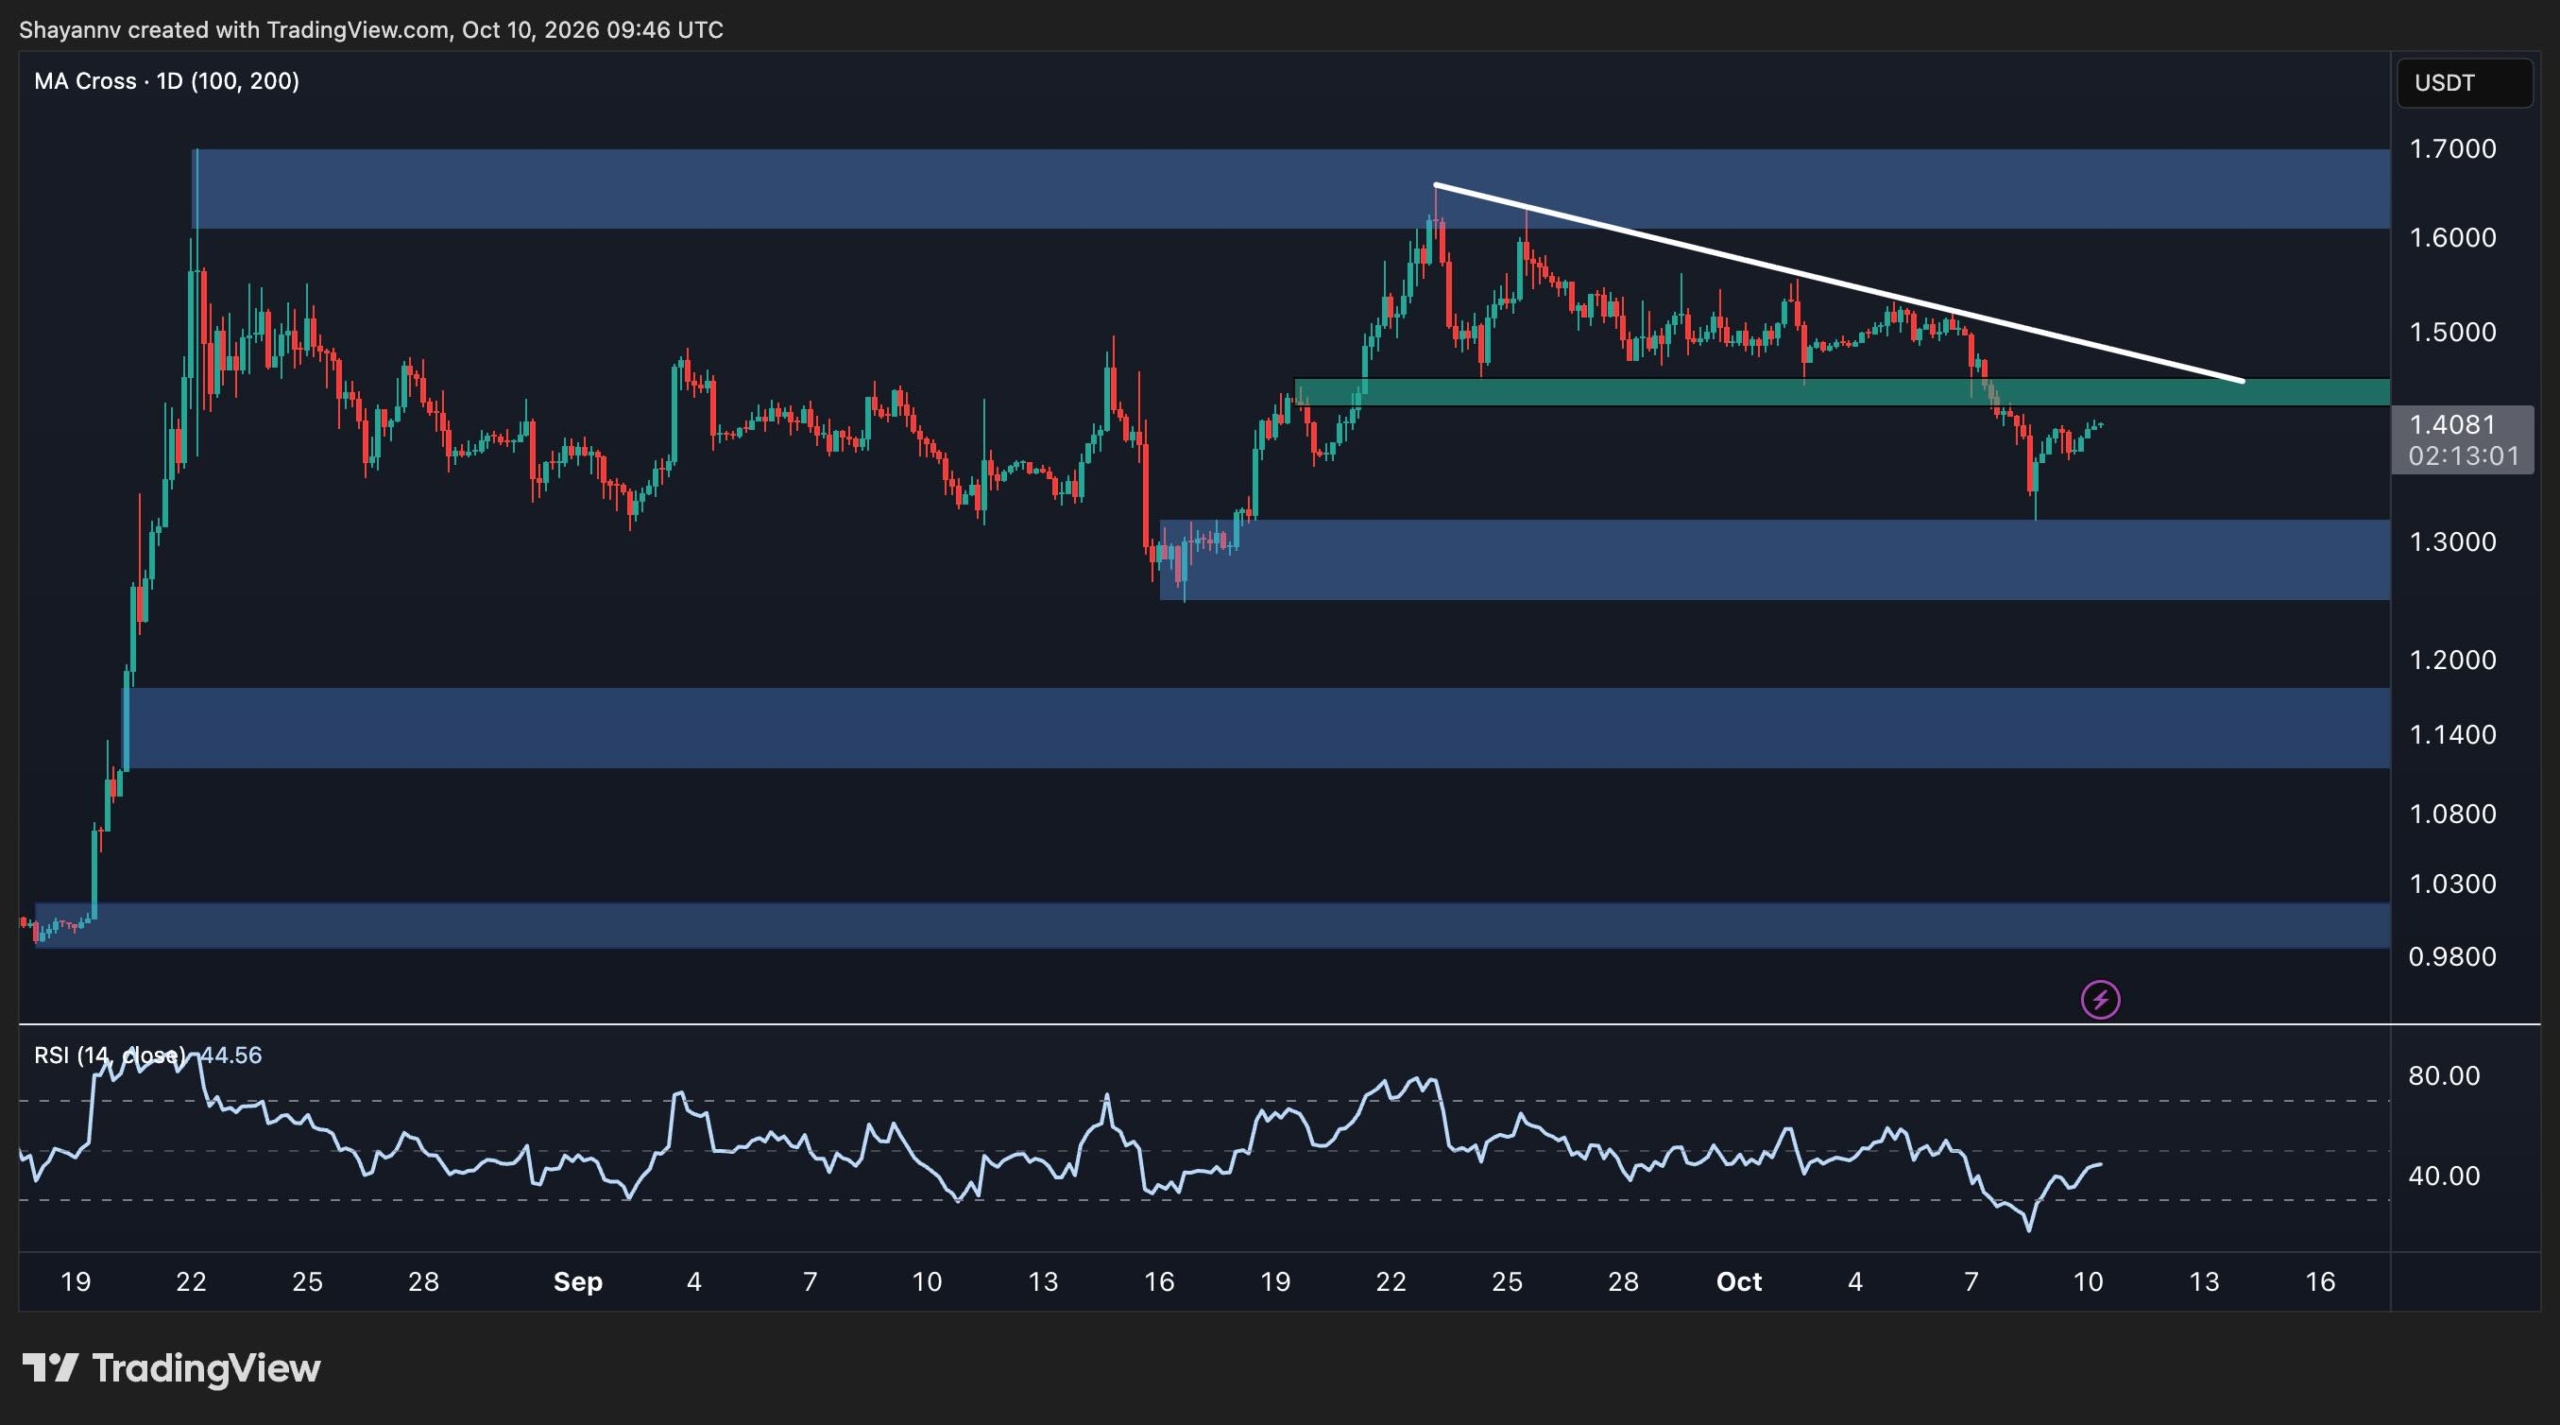
The 4-hour chart highlights the recent correction more clearly. XRP has been trading beneath a descending resistance trendline drawn from the September highs, with successive lower highs reflecting persistent selling pressure. The latest decline pushed the price toward the $1.30 support zone before buyers stepped in and initiated a modest rebound toward $1.40.
Despite this recovery, XRP remains below the $1.45 resistance area. This zone is particularly important because it aligns with the descending trendline, making it a key level for determining whether the latest rebound can develop into a broader recovery. A convincing breakout above $1.45 could invalidate the immediate bearish structure and allow the price to target the $1.60 region once more.
Conversely, a rejection near $1.45 could send XRP back toward the $1.15 imbalance which was formed during the almost vertical rally mid-August. With the 4-hour RSI climbing back above the oversold region to approximately 40, selling pressure has moderated, although the indicator remains below 50 and does not yet confirm a bullish momentum shift.
Overall, XRP is at a pivotal point. The defense of $1.30 offers the bulls an opportunity to extend the rebound, but the descending 4-hour trendline and resistance near $1.45 remain significant obstacles. A breakout above this barrier would strengthen the recovery case, while a renewed loss of $1.30 would increase the risk of a deeper correction.
The post Ripple Price Analysis: XRP Tests Critical Trendline Following Recent Correction appeared first on CryptoPotato.
This articles is written by : Fady Askharoun Samy Askharoun
All Rights Reserved to Amznusa www.amznusa.com
Why Amznusa?
AMZNUSA is a dynamic website that focuses on three primary categories: Technology, e-commerce and cryptocurrency news. It provides users with the latest updates and insights into online retail trends and the rapidly evolving world of digital currencies, helping visitors stay informed about both markets.
