
The broader crypto market saw a wave of green today, and among the standout performers is Sui ($SUI), which has posted eight consecutive green candles within 24 hours, a 27% surge.
The rally follows a renewed appetite for risk in the market, triggered in part by U.S. President Donald Trump’s recent softer stance on trade relations with China.
Sui Prints Eight Green Candles — What’s Powering the Rally?
Sui’s rally appears to be driven by memecoin activities on its network.
Tokens like $LOFI and $BLUB have exploded in value over the past week, gaining 150% and 65%, respectively.
TOP GAINERS MEME ON SUI LAST 24H
The market’s buzzing again, and $SUI is looking stronger than ever. A big breakout could be just around the corner

Let’s check out the top meme gainers on Sui over the last 24h
Like and RT to support us
#Sui #SuiNetwork #memecoins pic.twitter.com/UhfLoj6qxB
— Sui Insiders
(@SuiInsiders) April 23, 2025


This surge in meme-driven activity has pushed daily transaction volume on the Sui network up by 54.7%, now totaling $4.47 billion, according to on-chain metrics.
Meanwhile, Sui’s ecosystem continues to expand.
Cetus, a leading DEX aggregator on Sui, has climbed into the top five swap aggregators and now ranks as a top 10 DEX across all chains by daily volume, according to data from DeFiLlama.
Wake up to a blazing hot day on @SuiNetwork
#Cetus is now a Top 5 Swap Aggregator and Top 10 DEX across all chains by daily trading volume — per @DefiLlama.
Where deep liquidity & superior efficiency meets massive flow.
pic.twitter.com/A4hyCudf9A
— Cetus
(@CetusProtocol) April 23, 2025
Despite being down 54% from its January 6 peak, the Sui network shows promising signs of fundamental growth.
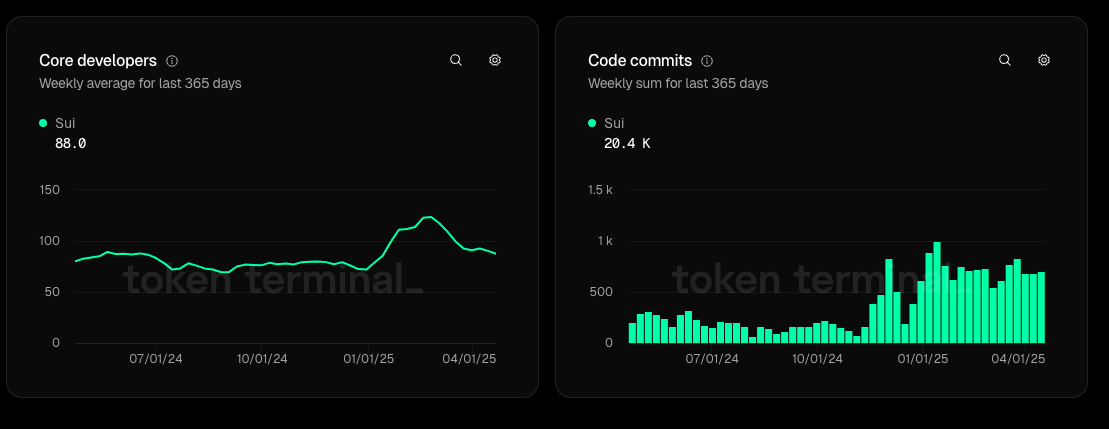
Developer activity is on the rise, with over 80 new developers joining the platform in the past week, pushing GitHub commits to over 20,400 contributions.
Analysts Eye New Highs for $SUI as Bullish Patterns Confirm Breakout
Analysts are eyeing further gains. Prominent Twitter analyst Karan Singh predicts a short-term high of $3.70, while chartist Finsends projects an ambitious upside target of $8.99, more than 150% above current levels.
Quick Update on $SUI:
– #Sui has dipped deeper into the final target area and is looking good now to go higher.
– If it has bottomed, the next target is at minimum $8,99.
– To confirm a bottom, we need to see five waves off the low.
– That means, the next step is reaching… https://t.co/6WhG0ZtDgx pic.twitter.com/iDWTOamzHg
— V (@finsends) April 22, 2025
Sui’s rising profile could be further boosted by institutional interest.
In March, digital asset investment firm Canary Capital Group submitted an application to the U.S. SEC for a spot Sui ETF.
If approved, it would mark the first-ever exchange-traded fund tied to the spot price of Sui. Analysts suggest this could propel Sui’s market cap beyond $15 billion, potentially placing it among the top 20 cryptocurrencies.
$SUI Technical Analysis: ABC Breakout Pattern Validates Bullish Structure on 4H Chart
On the 4-hour chart, $SUI/$USDT displays a bullish breakout pattern supported by a well-formed ABC wave structure.
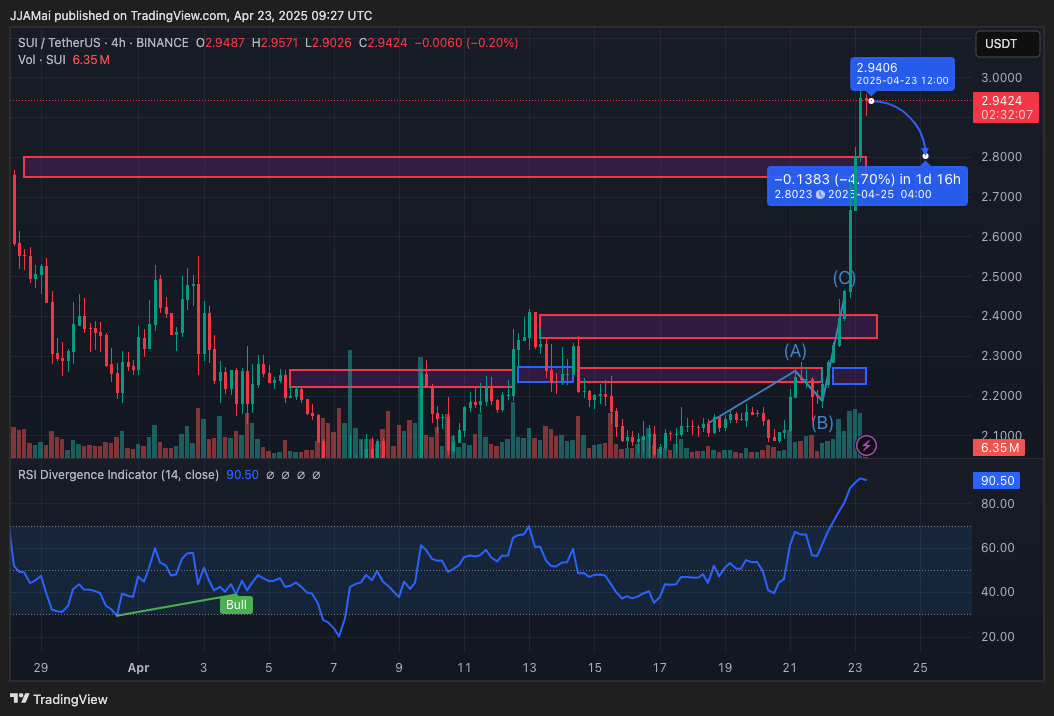
The token broke out of a consolidation range near $2.15–$2.25 (Wave A), retraced briefly to retest support (Wave B), and accelerated into Wave C, reaching a local high of $2.94.
However, the current price action is nearing a major resistance zone between $2.92 and $2.95, a level that marked the March decline.
While the RSI Divergence Indicator (14) confirmed a bullish divergence earlier this month, which played out successfully, the RSI now stands at 90.50, signaling highly overbought conditions.
$SUI BREAKING OUT
Retest of 2.37 to 2.2 is a good point to add trade with invalidation of close below 2.1 neckline.
Next targets are – 2.9 and 3.7

Trade on BingX : https://t.co/IRIMwkZF3W#crypto #altcoins pic.twitter.com/q0KJZf742w
— Karan Singh Arora (@thisisksa) April 22, 2025

If a pullback occurs, potential support zones lie at $2.80–$2.82, followed by $2.50–$2.55, and deeper at $2.30–$2.35, the base of Wave B.
Conversely, a decisive breakout above $2.95, backed by strong volume, could pave the way toward $3.20, further validating the bullish narrative.
The post Sui’s Breakout Rally Signals Bullish Continuation — Is $3.70 Next? appeared first on Cryptonews.
This articles is written by : Fady Askharoun Samy Askharoun
All Rights Reserved to Amznusa www.amznusa.com
Why Amznusa?
AMZNUSA is a dynamic website that focuses on three primary categories: Technology, e-commerce and cryptocurrency news. It provides users with the latest updates and insights into online retail trends and the rapidly evolving world of digital currencies, helping visitors stay informed about both markets.
